Filters
Using filters and exclusions is a great way to prune down a large graph to see just the elements that you want to explore. They are based on a subset of SQL (see bottom of page). In this example, we'll look at how to filter down within a Les Mis graph.
Filter Example
To filter this example, you need nothing more than a general idea of what nodes and edges you want to isolate and highlight. One thing to note for this example is that both nodes and edges have attributes so the selector will use point: instead of edge:.
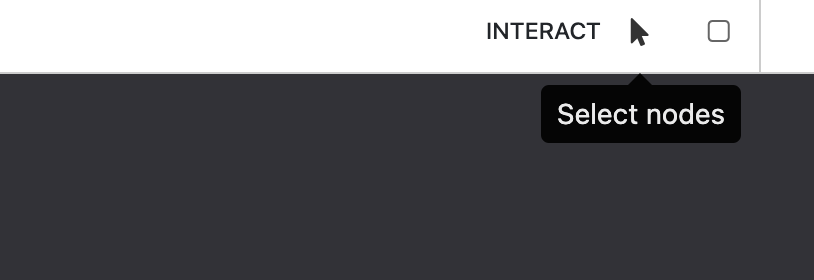
1. Select Nodes
At the top in your toolbar, click Select nodes to isolate which nodes for filtering
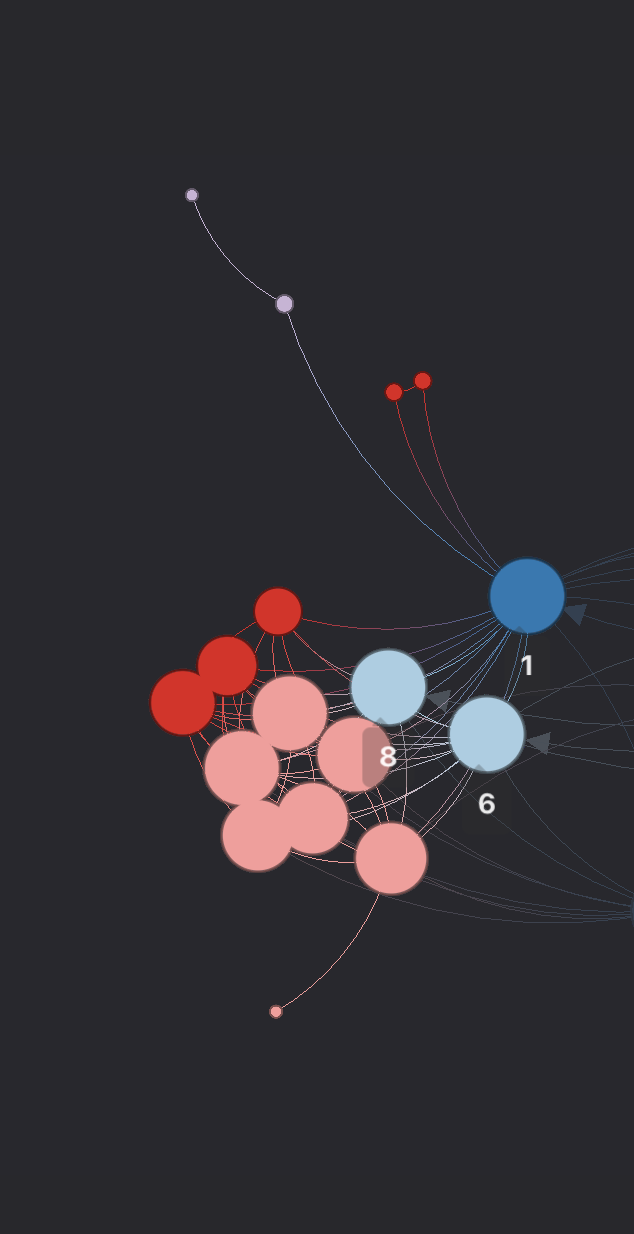
2. Create a Selection box
Simply draw a selection box by click-dragging or shift-clicking and releasing over a set of nodes
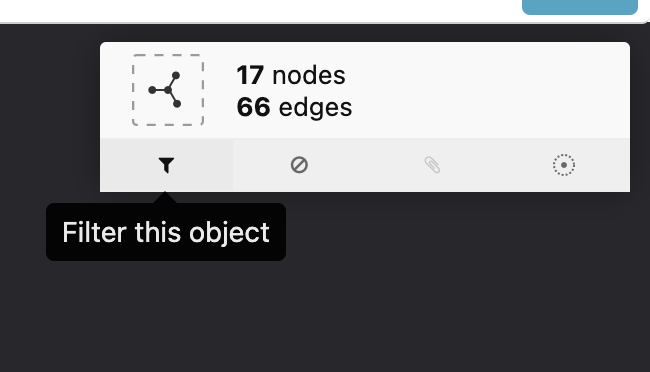
2. Create Filter option
Select "Filter this object" to produce a new graph with your selected nodes
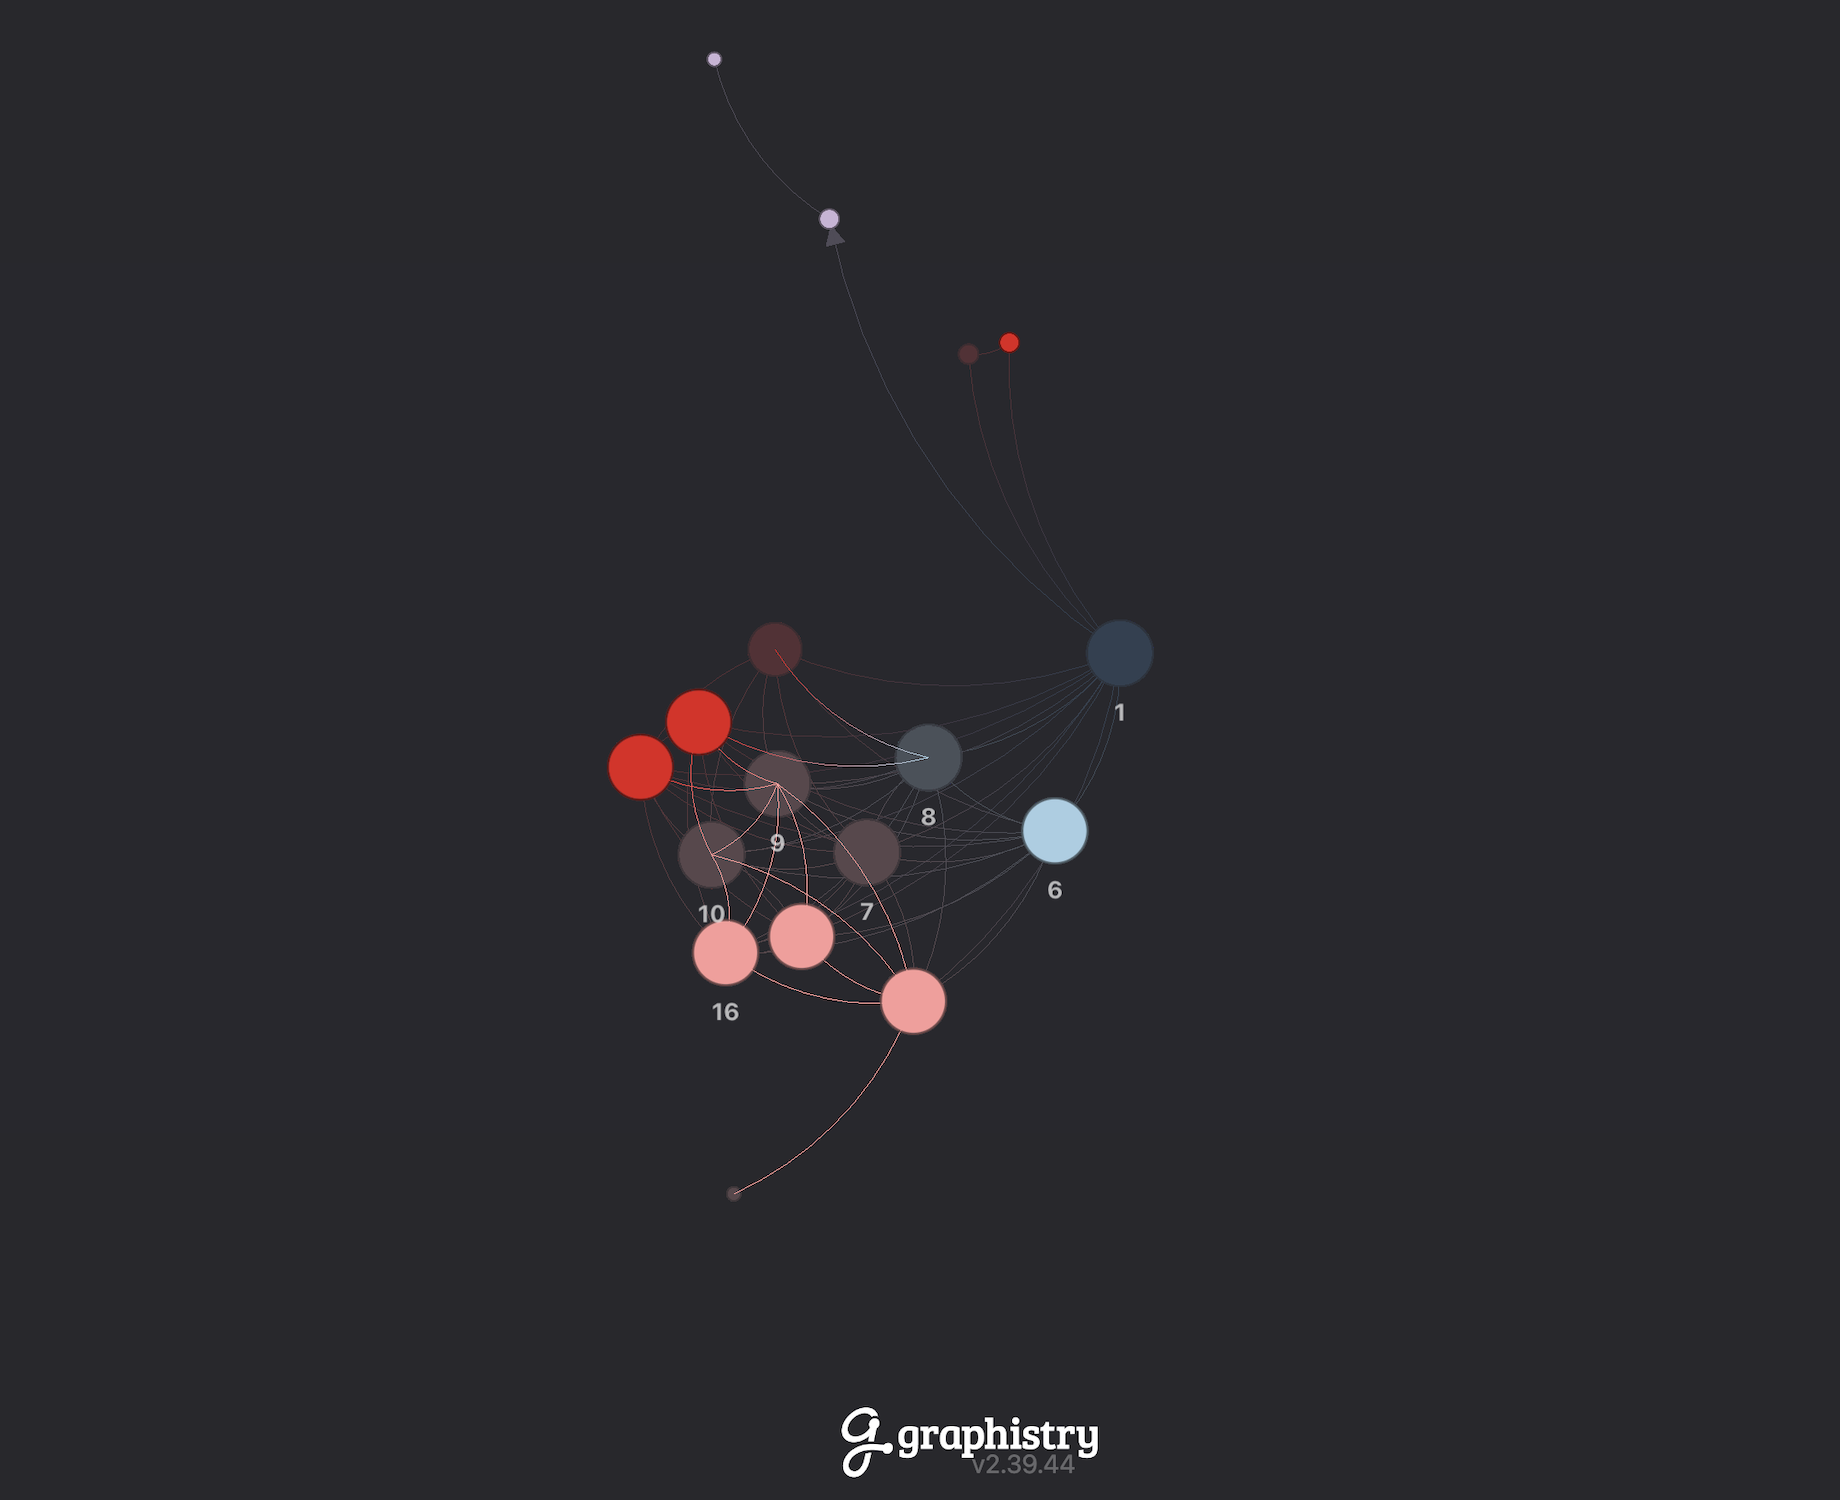
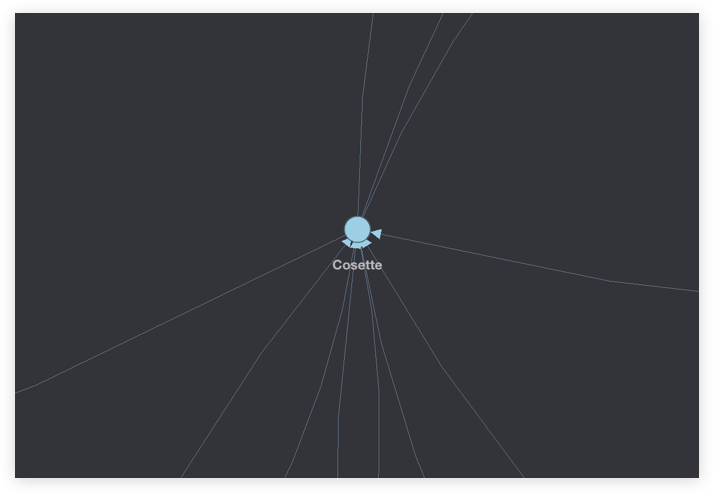
Result
Now we can see that we only have a handful of nodes, and we can recluster the graph to see connections.
Also try...
Exclusions, multi-hop expander, and filtering out standalone nodes
Exclusions work very similarly to filters, except they specify elements of the graph to remove. The multi-hop expander highlights the degrees of seperation between a multitude of nodes. If you disconnected nodes hidden, toggling "Hide standalone nodes" does that with a simple click
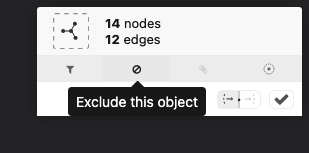
1. Exclusions
Following the same process for filtering your graph, you can find Exclude this object next to Filter this object. Selecting the former will produce a graph in absence of your selections.
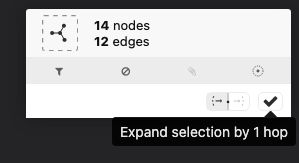
2. Multi-hop expander
Right below your filter options is the multi-hop expander. You will be able to choose between Grow selection on incoming edges or Grow selection on outcoming edges
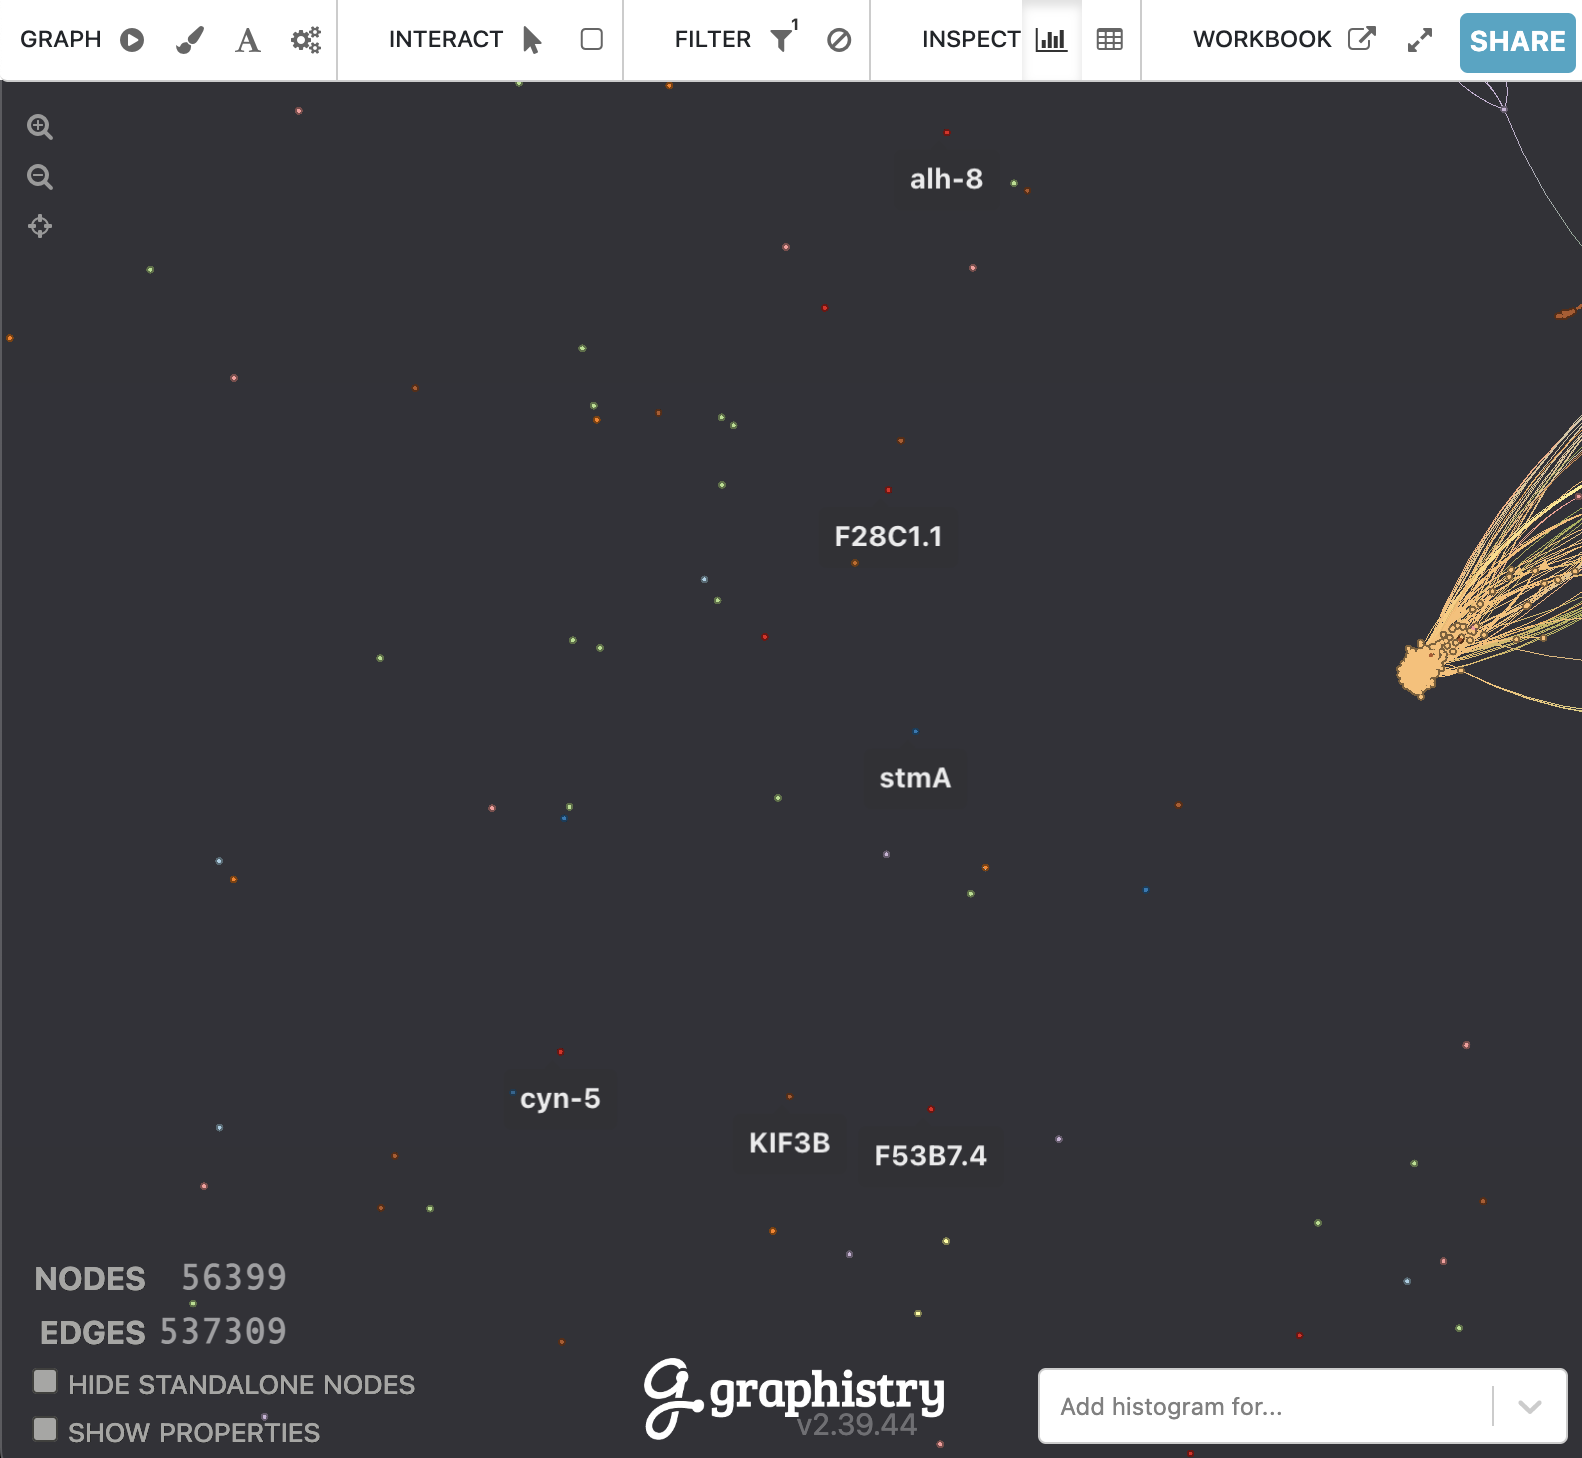
3. Hide Standalone Nodes & Central Magnet
In many datasets, especially after filtering, nodes will become disconnected from the rest of graph. There are two useful techniques for working with them:
Step 1:
Hide them by enabling the Hide Standalone Nodes toggle on the bottom left of the screen.
Step 2:
If you’d still like to see them, but without the clutter, perform step one, and then use the “move” feature to move the remaining graph to elsewhere on the screen. Disable the Hide Standalone Nodes toggle to show the individual nodes again, except no longer interleaved with the graph.
Common Expressions
| name | example | description |
| numeric comparison | point:degree < 10 | compare the attribute on the left with a constant on the right using comparators <, <=, ==, !=, >, >= |
| range comparison |
point:degree between 5 and 20 edge:time BETWEEN "Wed Sep 03 2014 14:48:40 GMT+0000 (Coordinated Universal Time)" AND "Mon Nov 10 2014 08:31:26 GMT+0000 (Coordinated Universal Time)" |
Compare for inclusion with a range. Attribute can be a number or ISO 8601 date. |
| exact string match | point:title = "mytitle" point:title != "mytitle" |
compare the attribute on the left to the string on the right |
| partial string match | point:title like "%the%" point:title ilike "%the%" |
check the attribute on the left for having the word "the" anywhere in it, and whether to be case sensitive |
| set inclusion | point:degree in (1, 3, 5) | check if the attribute on the left is any of the values in the list on the right |
| null comparison | point:title != null point:title in (null, "sometitle") |
check if the attribute has no value |
Looking for more information?
Browse our in depth UI guide slideshow to take you through all the details of the Graphistry tool suite.